


Rob Smith – Introduction To The STRAT
Original price was: $599.00.$16.00Current price is: $16.00.
Rob Smith Introduction To The STRAT Course [Instant Download]
What is Rob Smith Introduction To The STRAT?
Introduction to The STRAT is a trading course that teaches you how to read price charts without complex indicators. Created by Rob Smith, this method breaks down all market movements into three basic patterns that work in any market—stocks, forex, crypto, or futures.
The STRAT shows you how to spot trends, reversals, and trading opportunities by focusing only on what price actually does. Its unique approach connects different timeframes to help you make better trading decisions.
Unlike other systems, The STRAT cuts through market noise with clear rules that both new and experienced traders can apply immediately.
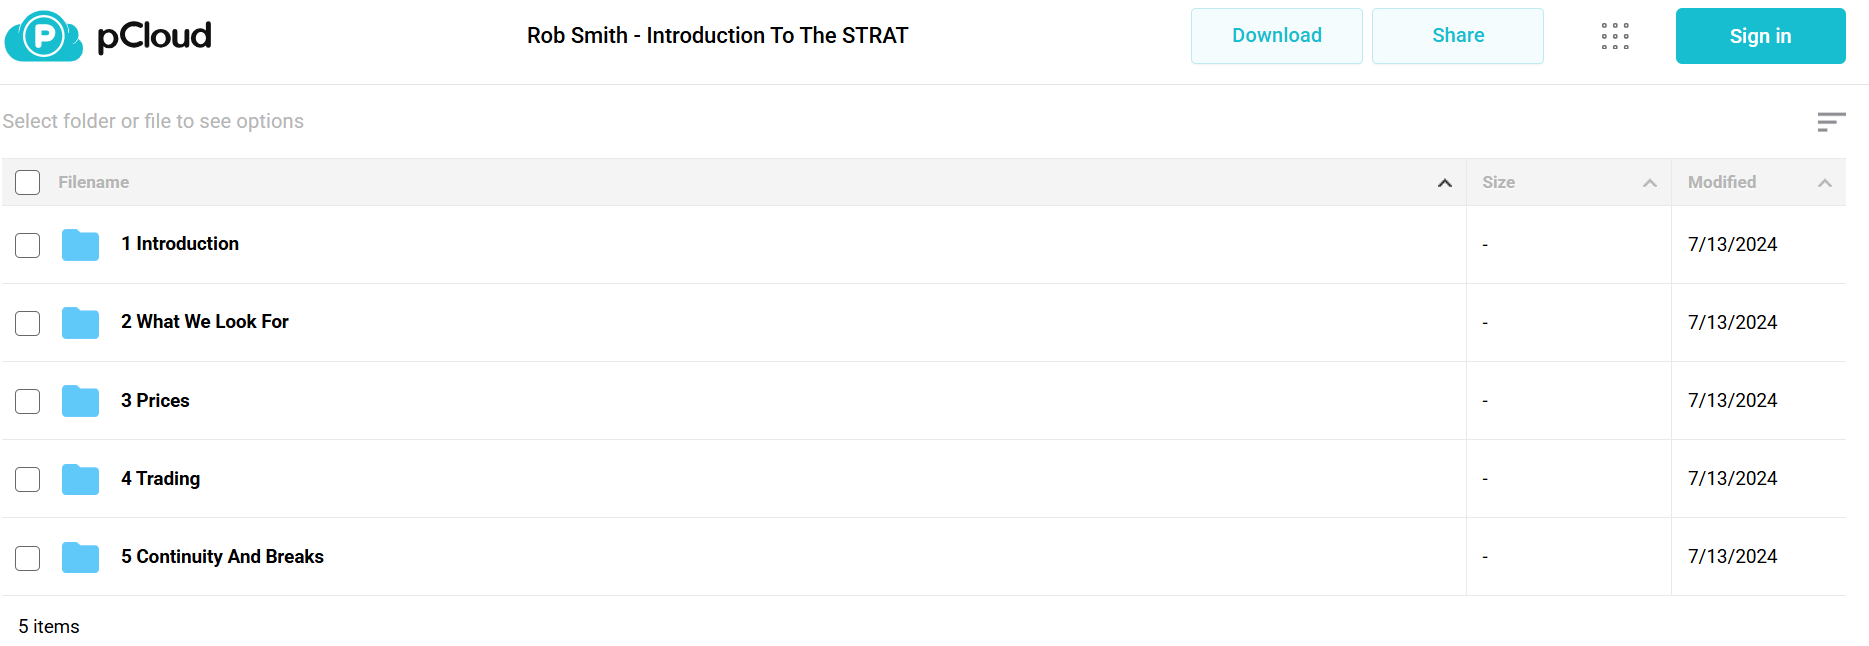
📚 PROOF OF COURSE
What you’ll learn in Introduction To The STRAT course:
The STRAT course gives you a simple way to understand market movements using price charts. Here’s what you’ll learn:
- Price action fundamentals that work in any market and timeframe
- Timeframe Continuity Principle to connect different timeframes for better trades
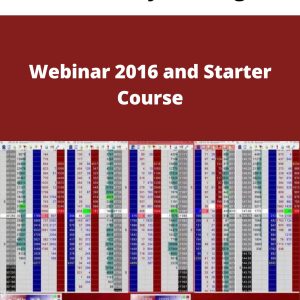
- Three universal scenarios (Inside, Directional, Outside bars) to read market conditions
- Gap trading strategies to profit from market openings
- Scanning techniques to quickly find trading opportunities
- Simultaneous breaks to confirm strong market moves
After this course, you’ll have a trading system that ignores market noise and focuses only on what price actually does.
Rob Smith Introduction To The STRAT Course Curriculum:
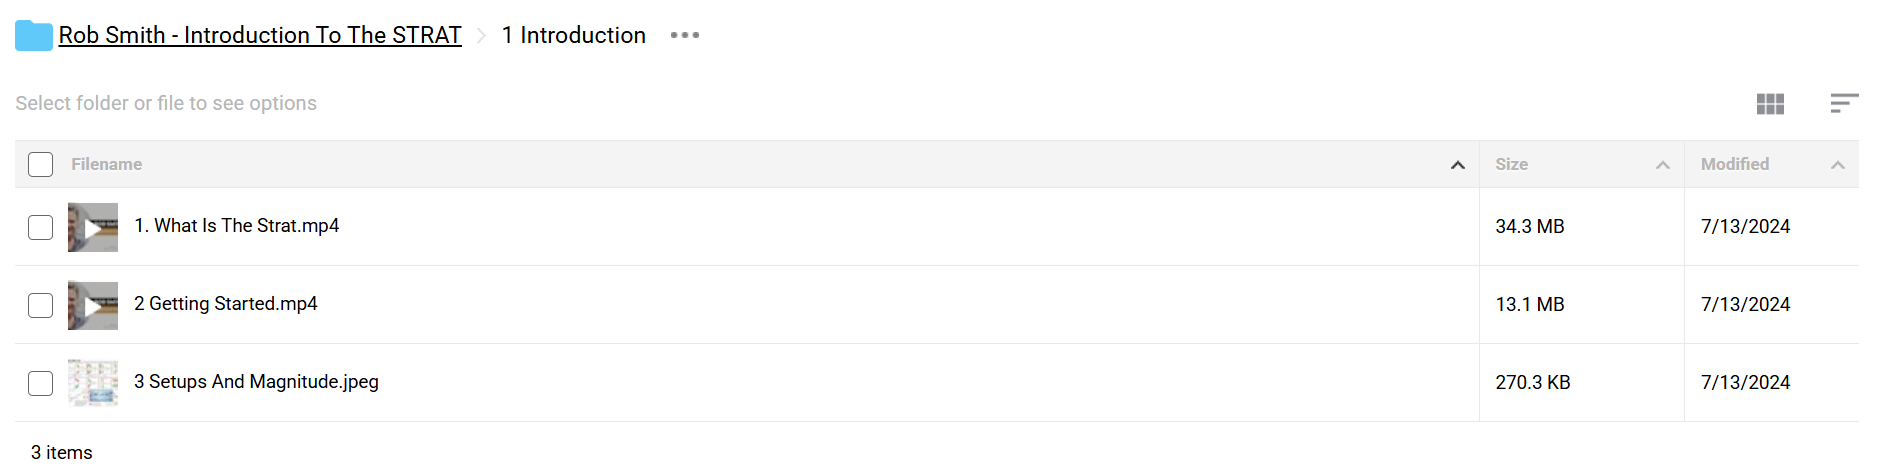
✅ Module 1: Introduction
This foundational module establishes the core principles of The STRAT methodology. Students learn the fundamental concepts, initial setup requirements, and how to recognize pattern magnitude—a key aspect for identifying significant market moves.
The “What Is The STRAT” lesson provides the conceptual framework, explaining how this methodology differs from conventional trading approaches. “Getting Started” offers practical first steps for implementing The STRAT in your trading routine, while “Setups And Magnitude” teaches how to recognize the strength and potential of different market patterns.
✅ Module 2: What We Look For
This three-part module explores the specific price patterns and market conditions that form the basis of The STRAT methodology. Students develop the ability to recognize high-probability trading opportunities across different market conditions.
Each part builds progressively on pattern recognition skills, teaching traders how to distinguish between routine market noise and significant actionable setups. By the end of this section, students can confidently identify The STRAT patterns in real-time across various markets and timeframes.
✅ Module 3: Prices
This module delves into price behavior dynamics, focusing on two critical aspects of market movement: continuity and reversal. Students learn to anticipate how and when prices are likely to extend in their current direction versus when they might change course.
“How Prices Continue” examines the conditions and patterns that suggest an ongoing trend, helping traders stay in profitable positions longer. “How Prices Reverse” covers the signals and setups that precede market turns, enabling traders to exit positions before major reversals or enter new positions at optimal turning points.
✅ Module 4: Trading
This practical module bridges theory and application, covering specific trading scenarios and techniques for improving execution. Students learn concrete strategies for trading gaps, efficient market scanning, identifying correlated sector movements, and focusing on the most productive trading opportunities.
“Trading Gaps” provides specific strategies for one of the most opportunity-rich market phenomena. “Scanning Technique” teaches efficient methods to quickly identify The STRAT setups across numerous charts. “Sector Specific Simultaneous Breaks” explores how to capitalize on related stocks moving in concert, while “Refine Your Universe” helps traders focus on the most suitable markets for their trading style.
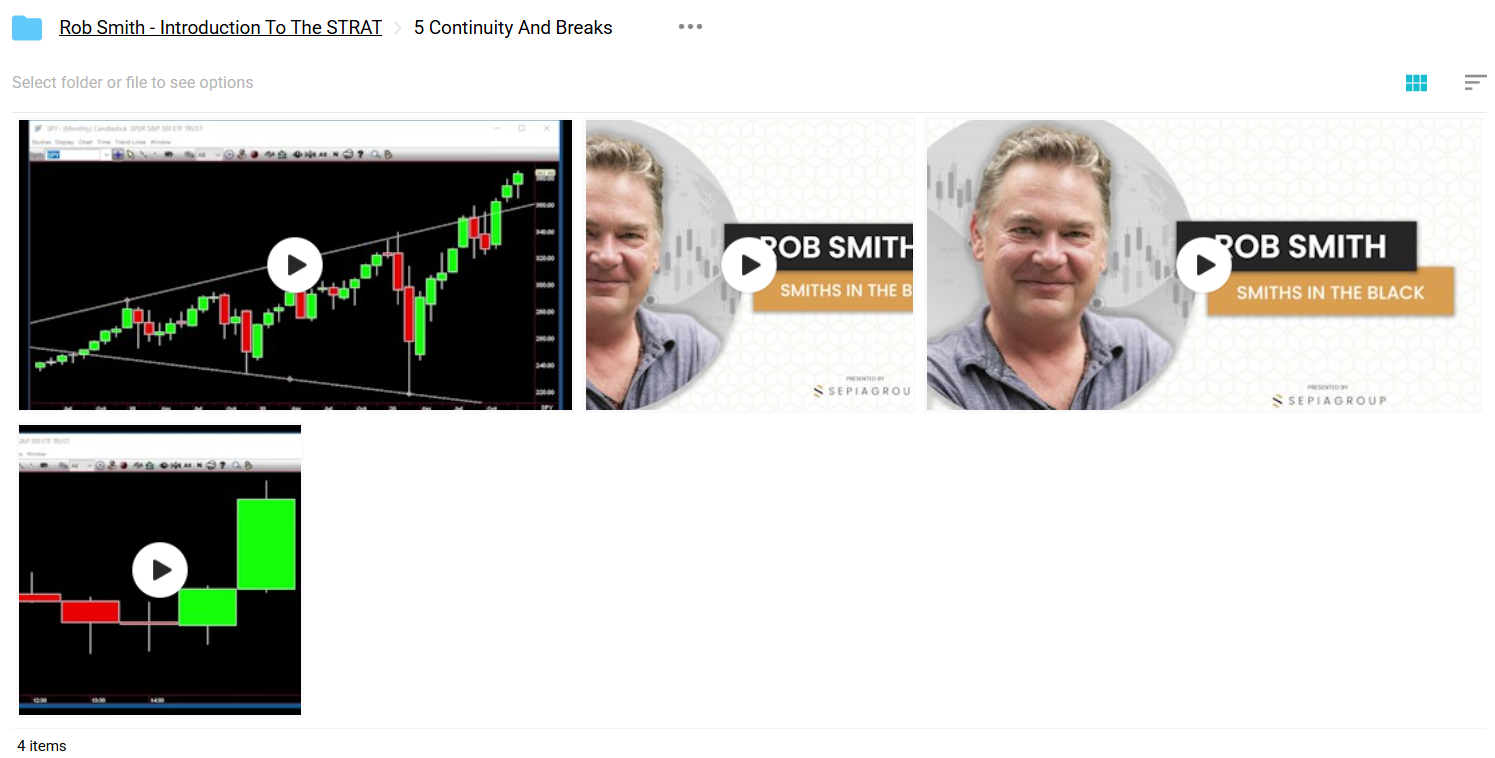
✅ Module 5: Continuity And Breaks
The advanced final module explores the relationship between timeframes and how price patterns interact across different chart intervals. This section synthesizes previous concepts into a cohesive framework for understanding complex market behavior.
“The Time Frame Continuity Principle” examines how patterns in one timeframe affect and predict movements in others. “Definition of Compound 3” covers an advanced pattern with particularly strong predictive qualities. “Simultaneous Breaks” and “Flips And Simultaneous Breaks” explore powerful setups that occur when multiple patterns align, often preceding significant market moves.
Who is Rob Smith?
Rob Smith created “The STRAT,” a trading system based on his years of market experience. He designed it to make trading simpler and more accurate by focusing on price action.
Rob’s method looks only at real price movements, not complex indicators. He breaks down all price action into three basic scenarios, giving traders a clear system to follow.
Rob shares his trading ideas on Twitter as @RobInTheBlack, where he has many followers. Traders can see his market analysis and setups there.
The STRAT works well across all markets and timeframes. Rob teaches practical methods and clear rules that any trader can use right away.
Trading platforms like MetaTrader and TrendSpider now offer special indicators for The STRAT, showing how popular and effective it has become.
Be the first to review “Rob Smith – Introduction To The STRAT”
Related products

Forex Trading

Forex Trading
Forex Trading

Forex Trading

Day Trading
Forex Trading

Forex Trading
Reviews
There are no reviews yet.