
-
×
 Paul Hilse – Freedom Accelerator Course
1 × $17.00
Paul Hilse – Freedom Accelerator Course
1 × $17.00 -
×
Curious Refuge – The World's First AI Filmmaking Course
1 × $12.00
 Paul Hilse – Freedom Accelerator Course
  Curious Refuge – The World's First AI Filmmaking Course


The Chart Guys – Entries And Exits Strategy
Original price was: $200.00.$12.00Current price is: $12.00.
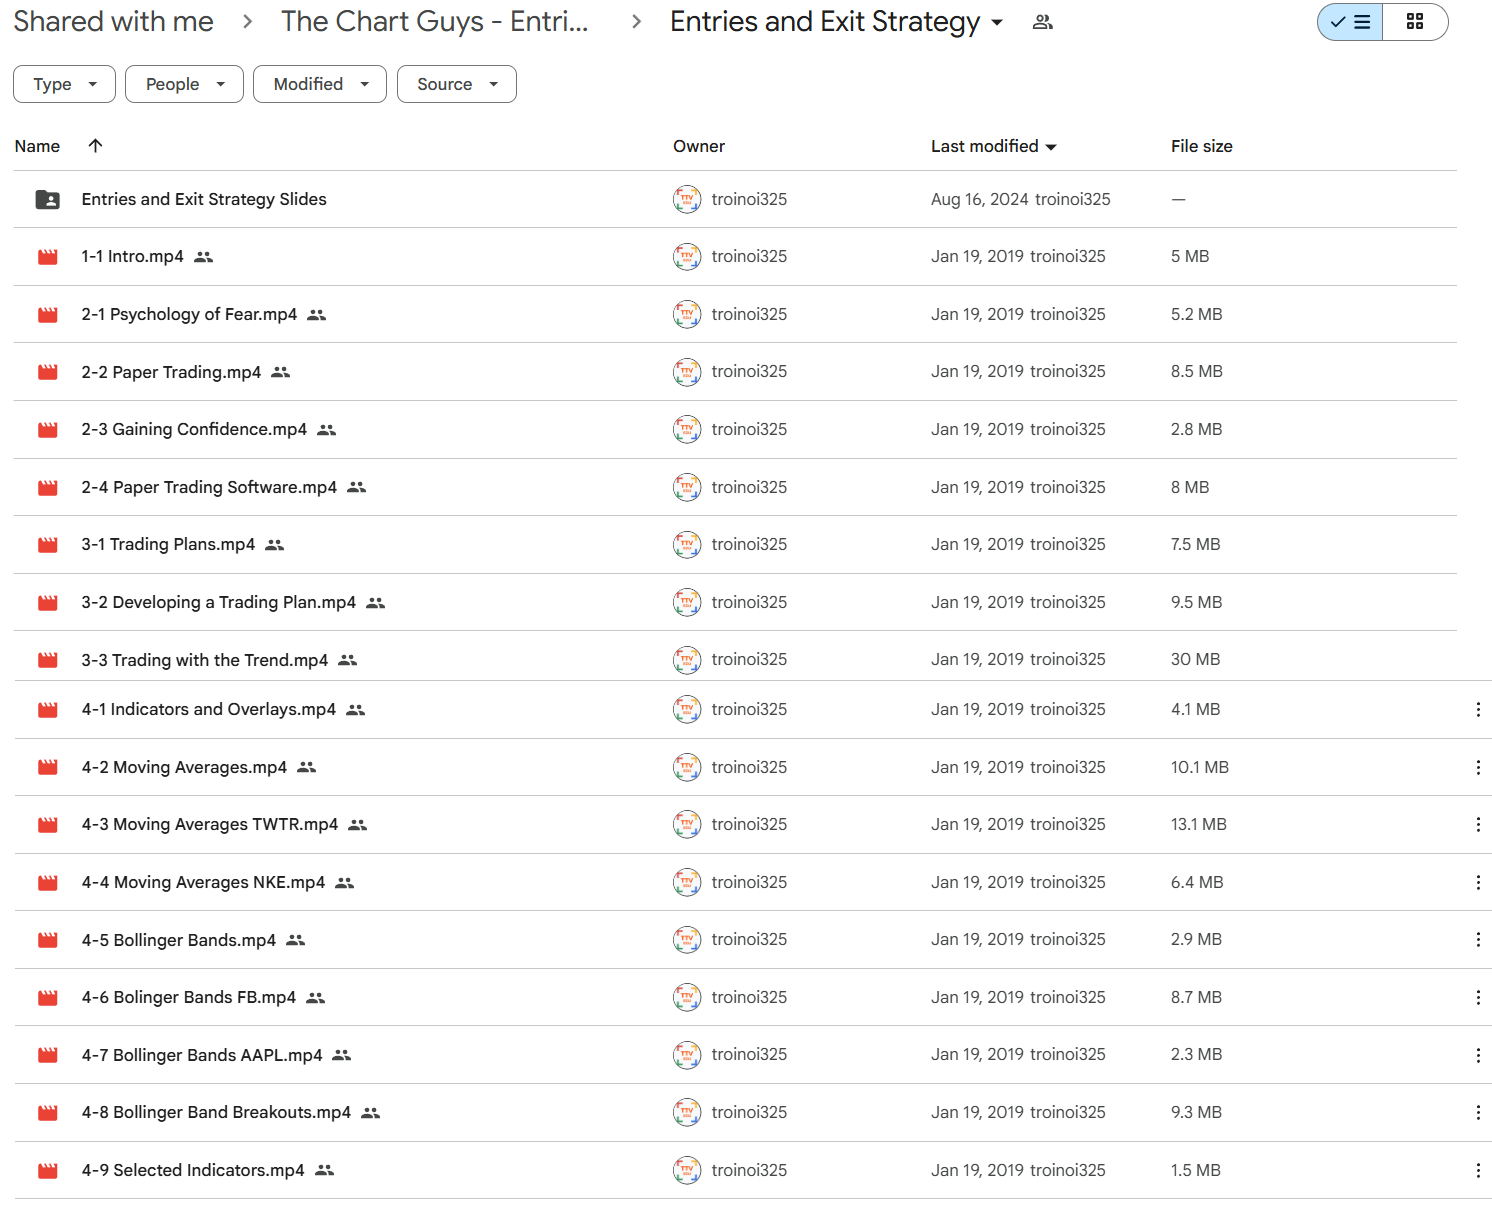
The Chart Guys Entries And Exits Strategy Course [Instant Download]

What is ChartGuys Entries And Exits Strategy?
The Chart Guys Entries And Exits Strategy is a trading course teaching you perfect timing to enter and exit stock trades for maximum profits.
The course shows you how to use technical indicators like moving averages, MACD, and Bollinger bands to spot the best buy and sell signals. You’ll learn to read chart patterns that reveal when prices will move up or down.
The program covers trading psychology to control emotions that cause poor decisions. You’ll master risk management and stop losses to protect your capital from big losses.
This system helps you stop buying high and selling low by recognizing the right market signals. The course teaches you to develop organized trading plans that remove guesswork and emotions from your trading decisions.
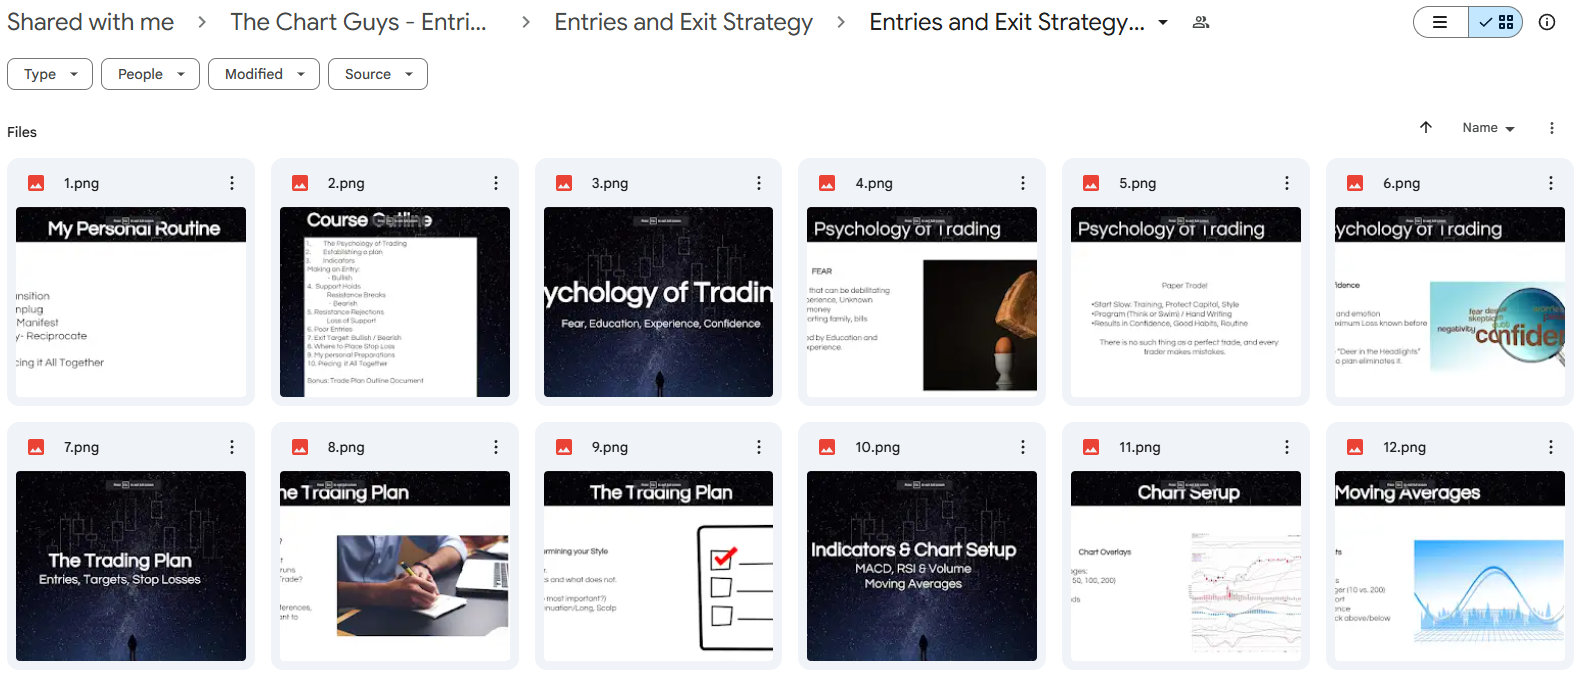
📚 PROOF OF COURSE

What you’ll learn in Entries And Exits Strategy Course:
This trading course teaches you the key skills for perfect market timing and profitable trades. Here’s what you’ll learn:
- Trading psychology: Beat fear and emotions that hurt your trading profits
- Technical indicators: Use moving averages, MACD, RSI, and Bollinger bands for better entries
- Risk management: Set proper stop losses and protect your money effectively
- Price targeting: Find the best exit points to get maximum returns per trade
- Chart patterns: Spot visual signals that show when to enter and exit trades
- Daily preparation: Build daily routines that professional traders use
This course helps new and experienced traders get better timing. You’ll learn to avoid common mistakes and feel confident in your trading choices.
Chartguys Entries And Exits Strategy Course Curriculum:
✅ Module 1: Introduction
Students begin their journey with a complete introduction to the course setup and trading basics. This opening part sets expectations and gives the key groundwork for understanding how chart reading can be used step by step for trading decisions.
The section shows the importance of having a planned approach to trading and introduces students to the main ideas that will guide their learning throughout the whole course.
✅ Module 2: Trading Psychology and Paper Trading
Students learn about the mental challenges that destroy most traders, especially the fear-based choices that lead to steady losses. The section teaches how fear shows up in trading decisions and gives clear ways to beat emotional blocks that stop profitable trading.
The paper trading part lets students practice methods without risking real money while building confidence. Students learn to use paper trading software well and understand how to move from fake trading to real money management.
This mental foundation is key because chart skills alone cannot beat emotional trading mistakes that hurt most regular traders.
✅ Module 3: Trading Plans and Trend Analysis
Students learn to make complete trading plans that remove emotion and guesswork from their trading choices. The section focuses on the importance of having set buy and sell rules before entering any trade.
Trend study becomes the main part of successful trading as students learn how to spot and trade with the main market direction rather than fighting against it. This part teaches students why trading with the trend greatly improves their chances of success.
The mix of solid planning and trend spotting creates the base for all other chart reading skills.
✅ Module 4: Technical Indicators and Market Analysis Tools
Students dive deep into the most helpful chart tools, starting with moving averages and their real uses. Through real-world examples using stocks like Twitter (TWTR) and Nike (NKE), students see how moving averages give clear buy and sell signals.
Bollinger Bands study follows with detailed case studies of Facebook (FB) and Apple (AAPL), teaching students how to spot when stocks are overbought and oversold. The section covers Bollinger Band breakout methods that can signal big price moves.
MACD (Moving Average Convergence Divergence) teaching includes Twitter examples and important exceptions to standard MACD readings. Students learn RSI (Relative Strength Index) uses for timing entries and exits based on momentum.
Volume study finishes this complete technical section, with real examples using Costco (COST) and other stocks to show how volume backs up price moves and signals big money involvement.
✅ Module 5: Bullish Entry Strategies
Students learn to spot the best entry points for bullish trades using price history study, moving average interactions, and psychological price levels. The section teaches how to recognize when stocks are likely to move higher and the specific rules that must be met before entering long positions.
Multiple case studies show how these bullish entry methods work across different market conditions and stock types. Students develop the ability to tell the difference between high-chance bullish setups and false signals that trap new traders.
✅ Module 6: Bearish Entry Strategies and Short Selling
This advanced section teaches students how to spot when stocks are likely to drop and how to profit from these moves. Using detailed examples from Twitter (TWTR), Tesla (TSLA), and Gold, students learn the specific chart patterns that signal bearish chances.
Students learn the art of short selling and understand how bearish entries differ from bullish methods. The section covers the unique risks and rewards that come with trading market drops.
These skills are needed for traders who want to profit in all market conditions rather than only during bull markets.
✅ Module 7: Common Entry Mistakes and How to Avoid Them
Students look at the most common mistakes that destroy trading accounts, including chasing stocks after they’ve already moved a lot. The section gives clear examples of how missed signals lead to poor entries and big losses.
Early entries represent another big mistake that students learn to avoid through proper chart reading and patience. Each mistake is shown with real trading examples that show the money impact of these errors.
By understanding these common traps, students develop the discipline to wait for proper setups rather than forcing trades that don’t meet their rules.
✅ Module 8: Exit Strategies and Price Targeting
Students learn systematic approaches to setting price targets using moving averages, price history, and psychological levels. The module teaches how to identify realistic profit targets that balance greed with achievable gains.
Separate instruction covers bearish exit strategies for short positions, including how to target moving averages, price history levels, and psychological support areas. Students understand how exit strategies differ between long and short positions.
This module ensures students know how to lock in profits rather than watching winning trades turn into losses through poor exit timing.
✅ Module 9: Risk Management and Stop Loss Strategies
Students master the critical skill of setting appropriate stop losses to limit downside risk on every trade. The module covers different types of stop losses and when each type is most appropriate for specific trading situations.
Common stop loss questions are addressed, including how tight to set stops and when to adjust them as trades move favorably. Swing trading applications show how stop losses adapt to longer-term position holding.
Special attention is given to stop loss placement for bearish trades, which require different risk management approaches than bullish positions. Students learn that proper risk management is what separates professional traders from gamblers.
✅ Module 10: Daily Preparation and Trading Psychology
The final module focuses on the daily mental preparation required for consistent trading success. Students learn pre-market routines that set them up for disciplined decision-making throughout the trading day.
Advanced psychological concepts help students maintain emotional equilibrium regardless of whether individual trades are profitable or unprofitable. This module reinforces that trading success comes from executing a proven system consistently rather than trying to predict every market movement.
What is The Chart Guys?

The Chart Guys is a trading education platform founded by experienced traders, including Dan McDermitt, known as “ChartingManDan.”
The team teaches technical analysis and has helped thousands of traders improve their skills in stocks, cryptocurrencies, and options markets.
Dan McDermitt has years of real trading experience. He created proven methods for market timing and risk management that work in actual market conditions.
The Chart Guys delivers quality trading education that mixes theory with hands-on practice. Their courses are made by active traders who know the problems both new and experienced traders face.
Be the first to review “The Chart Guys – Entries And Exits Strategy”
Related products

Uncategorized
Original price was: $2,499.00.$12.00Current price is: $12.00.

Uncategorized
Original price was: $397.00.$18.00Current price is: $18.00.

Uncategorized
Original price was: $1,497.00.$21.00Current price is: $21.00.

Uncategorized
$24.00

Uncategorized
Original price was: $997.00.$12.00Current price is: $12.00.

Original price was: $449.00.$50.00Current price is: $50.00.

Uncategorized
Original price was: $397.00.$32.00Current price is: $32.00.
Reviews
There are no reviews yet.